Risk Reward Ratio: How to Calculate It and What a Good One Looks Like
The risk reward ratio compares what a trade can lose with what it can make. Measure the distance from entry to your stop loss, then from entry to your take profit: a trade that risks $580 to make $1,740 has a ratio of 1:3. The number tells you how much a winner pays, not how often you will get one.
Risk reward calculator
Pick long or short, set the entry, then drag the stop and the target on the chart or with the sliders. Add margin and leverage to see what the same ratio means in dollars and where liquidation sits.
Drag the green or red handle on the chart, or use the sliders. Fees and funding are not included.
How to calculate the risk reward ratio
- Risk is the distance from entry to the stop loss.
- Reward is the distance from entry to the take profit.
- Divide reward by risk. Write the result after “1 :”.
Prices work, and so do percentages or dollars, as long as both sides use the same unit.
Long example: BTC
You buy BTC at 63,480 with a stop at 62,900 under the last swing low and a target at 65,220 below the previous high. Risk is 580, reward is 1,740, and 1,740 ÷ 580 = 3. The ratio is 1:3.
Short example: ETH
For a short everything flips: the stop sits above entry and the target below. Short ETH at 2,486, stop at 2,541, target at 2,376. Risk is 2,541 − 2,486 = 55, reward is 2,486 − 2,376 = 110. The ratio is 1:2.
Leverage does not change it
Run the BTC trade at 10× and the stop costs about 9.1% of your margin while the target pays about 27.4%. Both numbers grew tenfold, so the ratio is still 1:3. Leverage changes position size and moves your liquidation price closer. If liquidation sits above your stop on a long, the exchange closes you out before the stop gets a chance.
Several take profits
Signals often list three or four targets and close a part of the position at each. The honest ratio is the weighted average of all targets, not the last one.

Here is a real closed ATOM long we tracked: entry 1.507, stop 1.388, four targets at 1.527, 1.554, 1.600 and 1.690, a quarter of the position at each.
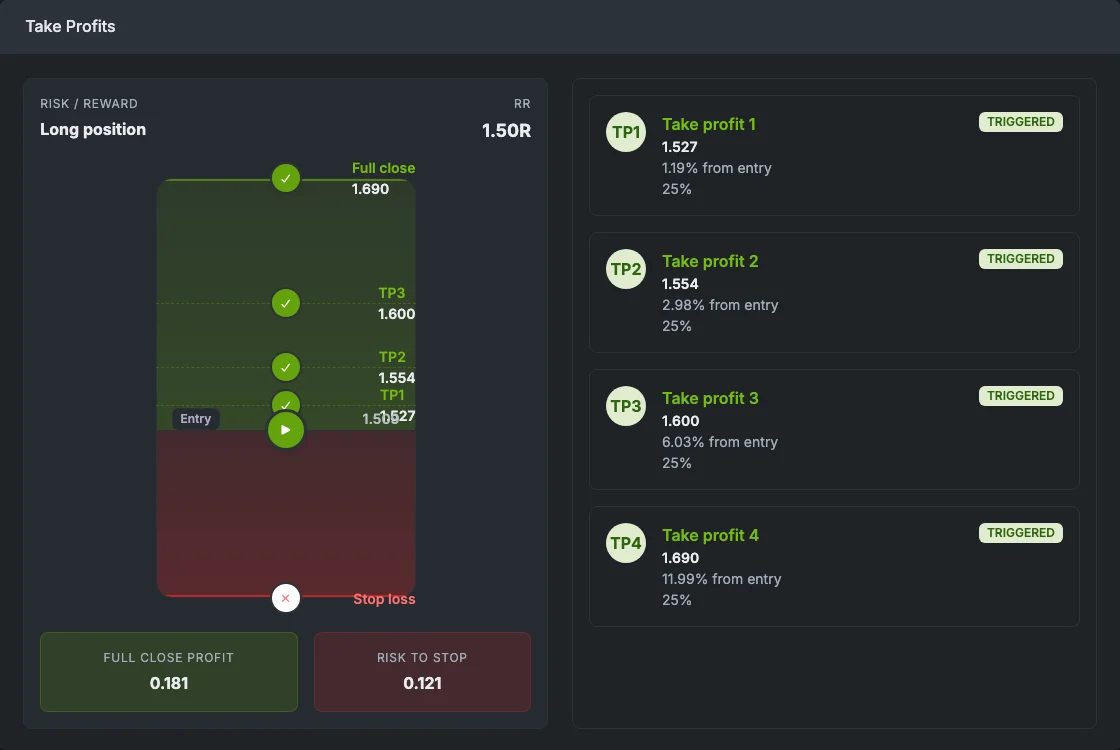
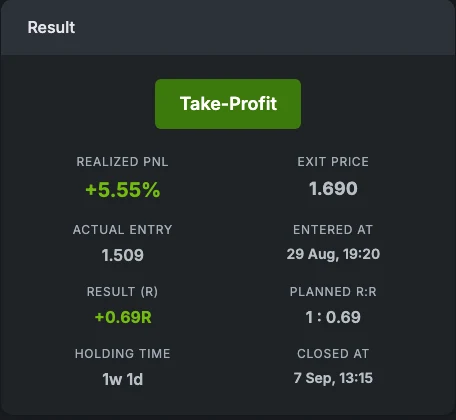
The entry filled at 1.509. From there, to the last target the ratio is about 1:1.5. Averaged over the four exits, each weighted by its 25%, it is 1:0.69, and that is also what the trade returned: +0.69R after all four targets hit. The channel announced it as +55.5%, which is the same move at 10× leverage.
How to read 1:3, 3:1 and 1.5
Two conventions are in use. This site, like the examples above, writes reward per unit of risk, so bigger means a larger target relative to the stop. Some finance texts divide risk by reward instead, and there 0.33 means the same trade as 1:3 and lower is “better”. Check which one a source uses before comparing numbers.
| Written as | Meaning | Reward per $1 risked | Break-even win rate |
|---|---|---|---|
| 1:3 | Risk first, then reward | $3.00 | 25% |
| 3:1 | Same trade, reward written first | $3.00 | 25% |
| 1.67 | Reward ÷ risk | $1.67 | 37.5% |
| 1.5R | Reward in units of risk (R) | $1.50 | 40% |
| 1:0.7 | Target closer than the stop | $0.70 | 58.8% |
| 0.33 | Risk ÷ reward (inverted form of 1:3) | $3.00 | 25% |
Risk reward ratio and win rate
A ratio without a hit rate is half a sentence. The two together tell you whether a set of trades makes money. The win rate at which you exactly break even is:
| Ratio | Break-even win rate | Result of 10 trades at 45% win rate |
|---|---|---|
| 1:0.5 | 66.7% | −3.25R |
| 1:0.7 | 58.8% | −2.35R |
| 1:1 | 50% | −1R |
| 1:1.5 | 40% | +1.25R |
| 1:2 | 33.3% | +3.5R |
| 1:3 | 25% | +8R |
The last column holds the win rate fixed at 45%. The same hit rate loses about 2.4R over ten trades at 1:0.7 and makes 8R at 1:3. That is why the ratio matters, and also why it is easy to fool yourself with it: in real markets the hit rate does not stay fixed when you move the target.
What is a good risk reward ratio?
The usual answer is 1:2 or 1:3. It is a fine default for a trade you plan by hand, and a poor rule to apply blindly. A good ratio is one where your real hit rate on that kind of setup stays above the break-even line with room to spare, after fees.
Before accepting a ratio, ask one question: is the target a level price has reason to reach? A target just under the last high is plausible. A target placed wherever makes the math look like 1:3 is a wish, and the ratio on paper goes up while the chance of getting paid goes down.

| Style | What limits the ratio | Check before raising it |
|---|---|---|
| Scalping (minutes) | Fees and spread take a big share of a small move | Ratio after round-trip fees, not before |
| Day trading (hours) | The session range caps how far price can go today | Does the target fit inside a normal daily range? |
| Swing trading (days) | Overnight gaps and funding on perpetual futures | Is there a clear level at the target, and what does funding cost while you wait? |
| Following signals | The channel chooses the levels, you choose the fill | Recalculate from your actual entry, weighted across all targets |
What real crypto signals aim for
We track Telegram crypto signals against exchange candles from the minute they are posted, and record the planned ratio of every signal next to what it returned. The picture is far from the 1:3 rule.
A median of 1:0.71 means the typical signal puts its stop further from entry than its targets. At that ratio a channel has to be right about 58% of the time just to break even. The tracked signals closed in profit 42% of the time, and the average signal returned −0.05R, which is close to nothing before fees.
Small ratios are not a flaw by themselves. A 1:0.7 signal that works seven times out of ten pays well. The problem is that channels advertise the percentage gain of the last target at leverage, and readers compare it with the 1:3 advice they read elsewhere. Neither number answers the question that matters: how often does this provider reach the targets it sets?
Every provider page on SignalTrack shows its average planned ratio next to its win rate and expectancy, so you can check both halves before following anyone. Compare providers by verified expectancy.
How these numbers are calculated
- 870 closed signals from 27 Telegram providers, Aug 2026 – Sep 2026. Updated daily.
- Planned ratio: distance to each take profit weighted by the share of the position closed there, divided by the distance to the stop, both measured from the price where the entry actually filled.
- Result: realized move divided by the distance to the stop (R). Signals without a stop, replays and signals excluded for data problems are left out.
- The largest provider accounts for 20% of the sample, so treat these as a snapshot of the channels we track, not of all signals.
Common mistakes
1. Tightening the stop to improve the ratio
Move the BTC stop from 62,900 to 63,190 and the ratio jumps from 1:3 to 1:6. The market did not change. A routine pullback of 300 now stops you out of a trade that would have worked. Put the stop where the idea is wrong, then see what ratio that gives.
2. Leaving out fees
With 0.05% taker fees on the way in and out, the BTC trade pays 2.64% instead of 2.74% and risks 1.01% instead of 0.91%. The ratio drops from 1:3 to about 1:2.6. On a scalp with a 0.3% stop the same fees cut a 1:2 trade to 1:1.25.
3. Quoting the last target
As the ATOM trade above shows, a four-target signal can look like 1:1.5 and behave like 1:0.7. Weight each target by the share of the position you close there.
4. Calculating from the posted entry instead of your fill
The ETH short was 1:2 from 2,486. Fill ten minutes late at 2,470 and the stop is 71 away while the target is 94 away: 1:1.3. Late entries on a signal quietly move the break-even win rate from 33% to 43%.
5. Treating a high ratio as an edge
A 1:4 plan that reaches its target 15% of the time loses 0.25R per trade. The ratio is a price tag, not a result. Your own win rate on similar trades, or a provider's verified one, is the other half.
FAQ
What does a 1.5 risk reward ratio mean?
The target is one and a half times as far from entry as the stop. Risk $100, aim to make $150. You break even if 40% of such trades hit the target, so it only pays if your real hit rate on these setups is clearly above 40%.
Is a risk reward ratio of 1.67 good?
It needs a win rate of 37.5% to break even (1 ÷ 2.67). That is a reasonable bar for a swing trade and a hard one for a scalp where fees take a large share of a small move. Check the ratio after fees and against how often similar targets were reached before.
What is a 3 to 1 risk reward ratio?
It is the same trade as 1:3, written reward first: you stand to make three times what you can lose. One winner covers three losers, so the break-even win rate is 25%.
Does leverage change the risk reward ratio?
No. Leverage multiplies the profit and the loss by the same factor, so the ratio stays put. It changes your position size and where liquidation sits. If liquidation is closer than your stop, the stop is decoration.
Is a higher risk reward ratio always better?
No. Pushing the target further raises the ratio and lowers the chance of reaching it. What pays is the combination: win rate × average win − loss rate × average loss. A 1:0.8 setup that works 65% of the time beats a 1:4 setup that works 15% of the time.
Check it on real providers
Educational content, not financial advice. Examples use illustrative prices except where a tracked signal is named.